
After the Intermission: Theater’s Uneven Recovery

Danger Boat cast members onstage during a performance.
After the Intermission: Theater’s Uneven Recovery
by Brandon Boat | August 13, 2026 | 30 min read
Is the Twin Cities nonprofit theater scene in crisis? Depends on who you ask.
Recent conversations about the health of local theater have been prompted by a visible moment: a company closing, a venue disappearing, a season being reduced, or a major source of funding going away.
Those pieces matter, but they’re not the whole story. One theater may be growing while another is cutting productions. A handful of major institutions may post strong financial results while dozens of smaller organizations struggle to break even.
To better understand the full picture, I assembled financial data from 93 nonprofit theater organizations in the Twin Cities metropolitan area, covering the years 2011 through 2024. The dataset includes organizations of dramatically different sizes, from major institutions with annual revenue above $10 million to small companies operating on less than $500,000. It also includes theaters that opened, closed, grew, contracted, or stopped reporting during that period.
The numbers reveal a sector that has recovered, but unevenly.
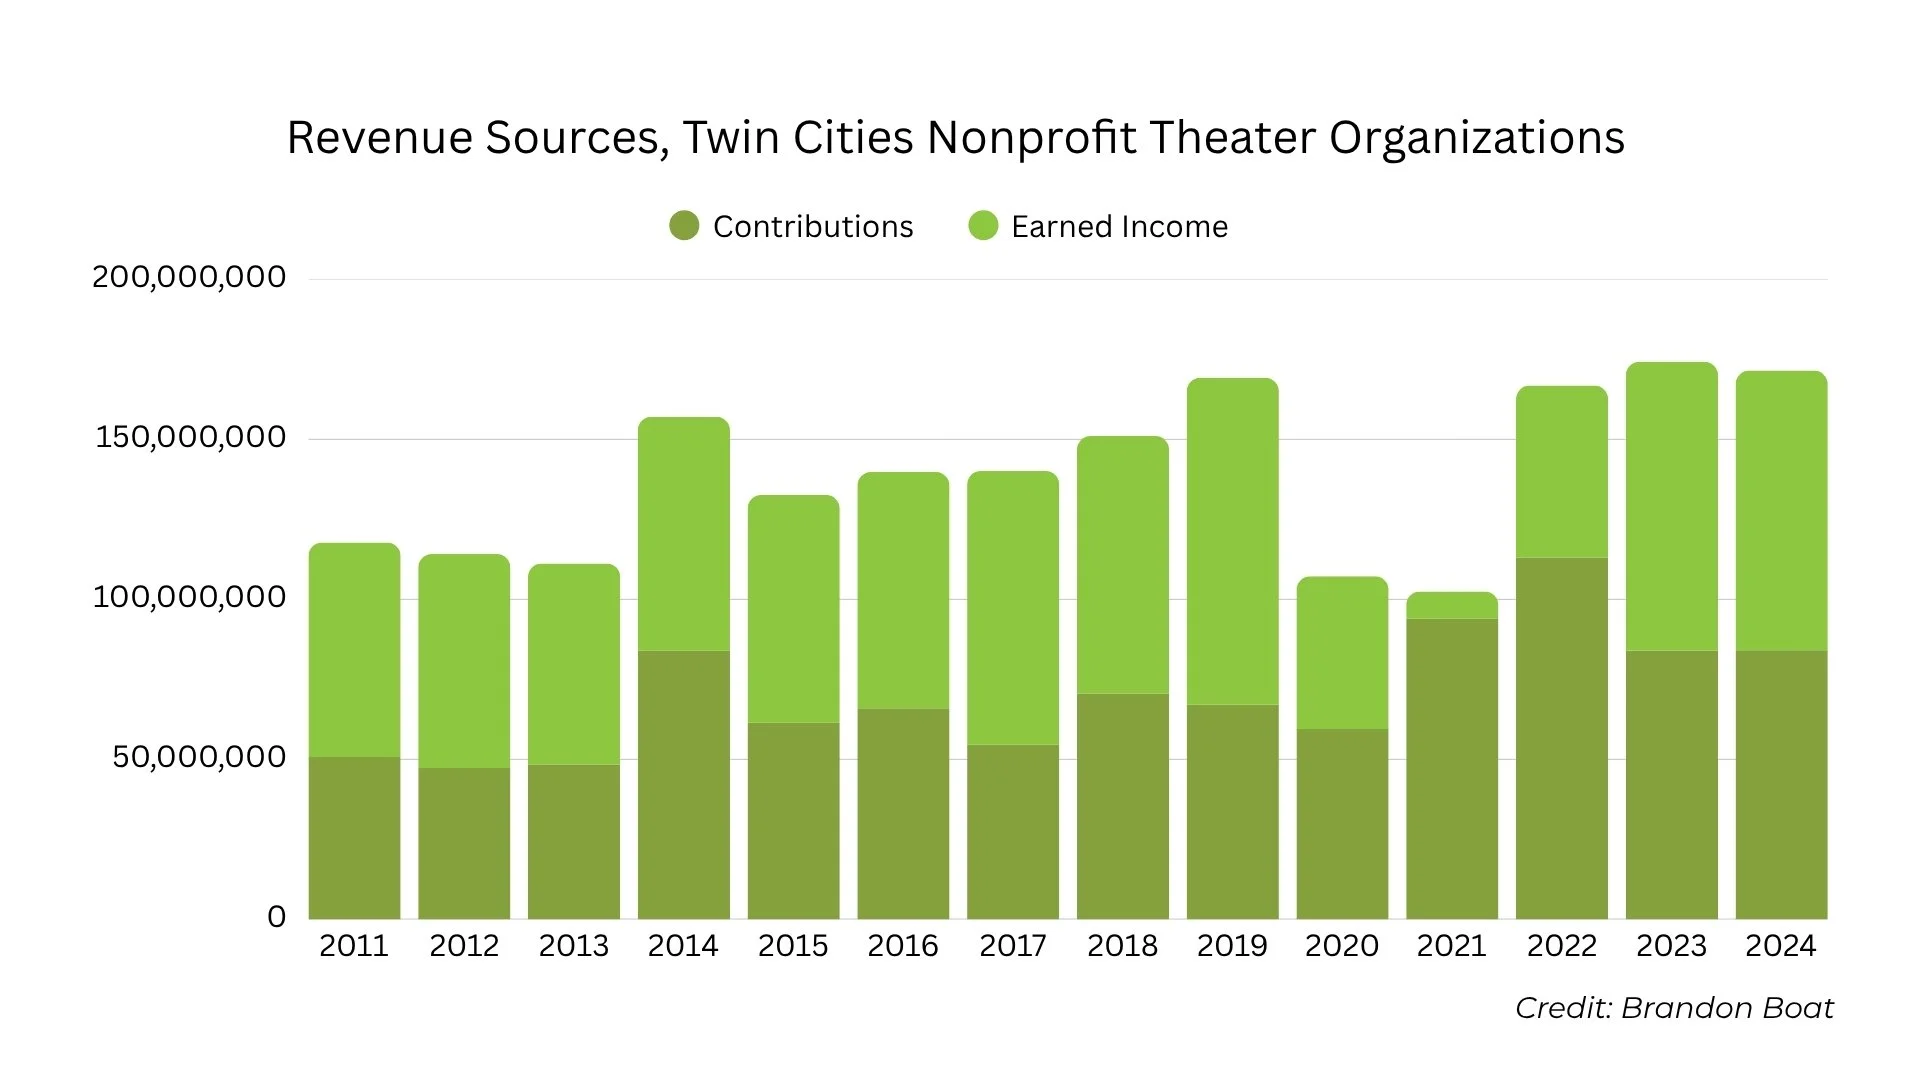
Collectively, Twin Cities nonprofit theaters generated more revenue in 2024 than they did before the pandemic. Assets have grown, liabilities have declined, and the field posted a substantial overall surplus. Sounds like good news, right? Yet at the same time, half of the organizations reporting revenue and expenses in 2024 operated at a deficit. Earned income from tickets and other programming remains below its 2019 level, and much of the sector’s apparent financial strength is concentrated among a small number of large institutions.
In other words, the big ships can make the harbor look calmer than it really is.
This analysis looks beyond individual headlines to examine how the Twin Cities theater economy has changed over the past fourteen years, what happened when the pandemic disrupted it, and how the recovery has looked different for large, mid-sized, and small organizations. Financial filings are lagging indicators, and they cannot capture every artistic, organizational, or human dimension of the field. But they can help us understand where the theater ecosystem has been and, perhaps, where it may be headed next.
How I Created the Data Set
Now for some fun details on ~tax filings~. Nonprofit organizations that are recognized as tax exempt by the IRS are required to file form 990 every year or Form 990-EZ if they have less than $200,000 in revenue and less than $500,000 in assets. Orgs that make less than $50,000 don’t have to file anything except a 990N e-Postcard.
I collected information from 990 reports that were posted on the website Pro-Publica. I started with 2011 up until 2024, as not all 2025 data has been made available yet. I included organizations that opened or closed their doors in the time frame.
The majority of the organizations’ fiscal years followed the calendar year, but not all of them. I did my best to reconcile those discrepancies. I then added the corresponding data to a spreadsheet, sorted pages by category and ranked the theaters by their average numbers (revenue, expenses, etc.) for the last 3 years.
In total, I collected information for 171 different theater organizations in the Twin Cities Metro area. I whittled that down to 114 nonprofits. Then, I eliminated 14 for having no reported data and another 7 for having finances heavily mixed with non-theater programming. That left me with financial information for 93 nonprofit theater organizations. 34 began reporting data during this period, meaning their income increased or they may have had their first performance. 17 stopped reporting data, meaning they may have fallen under the threshold or closed their doors.
In my analysis of the data, I looked at the theater scene as a whole (93 theaters) and broke out theaters by yearly revenue including:
6 Large Theaters (+$10,000,000),
27 Mid-Sized Theaters ($5,000,000 - $500,000),
and 60 small theaters (Sub $500,000).
Lastly, what is my definition of a theater? Sigh…this is where I feel the least steady. Generally, if an organization produces theater (scripted, improv, puppets, operas, theatrical dance, etc.) or regularly presents theater, I include them. My attempt to measure the health of the scene is not just counting artistic directors and actors, but also admin work and back of house that help make an opening night possible. I also excluded organizations that are connected under much larger nonprofit organizations such as Pillsbury House or The Capri Theater as it was too difficult to isolate the theater-only finances.
If for whatever reason you’re outraged by my inclusion or exclusion of a certain theater, I’ve provided the full dataset below. So by all means, run your own analysis and prove me a fool. But given the size of the data set, I think there will be only minor variances in the overall results for exclusions or inclusions.
The Data Collected
I was solely interested in financial reporting for this analysis. These are the categories that I included:
Revenue
The total amount of money an organization brings in during the year from all sources, including ticket sales, donations, grants, program fees, sponsorships, and investment income.
Expenses
The total amount an organization spends during the year to operate, produce programs, pay staff and artists, rent space, market events, fundraise, and cover administrative costs.
Total Assets
Everything the organization owns or controls that has financial value at the end of the year. This can include cash, investments, property, equipment, receivables, and other resources.
Total Liabilities
The organization’s financial obligations at the end of the year. This can include loans, unpaid bills, deferred revenue, mortgages, and other debts.
Contributions
Money received through donations, grants, gifts, and other charitable support. For nonprofit theaters, this often includes individual donors, foundations, government grants, and corporate sponsorships.
Program Services
Money the organization earns by selling goods or services, such as tickets, classes, workshops, rentals, touring fees, or performance contracts. For theaters, this is the revenue generated by the work itself rather than donated support.
Now, let’s dive into the data.
1. The Theater Scene as a Whole
The sector is recovering, but unevenly.
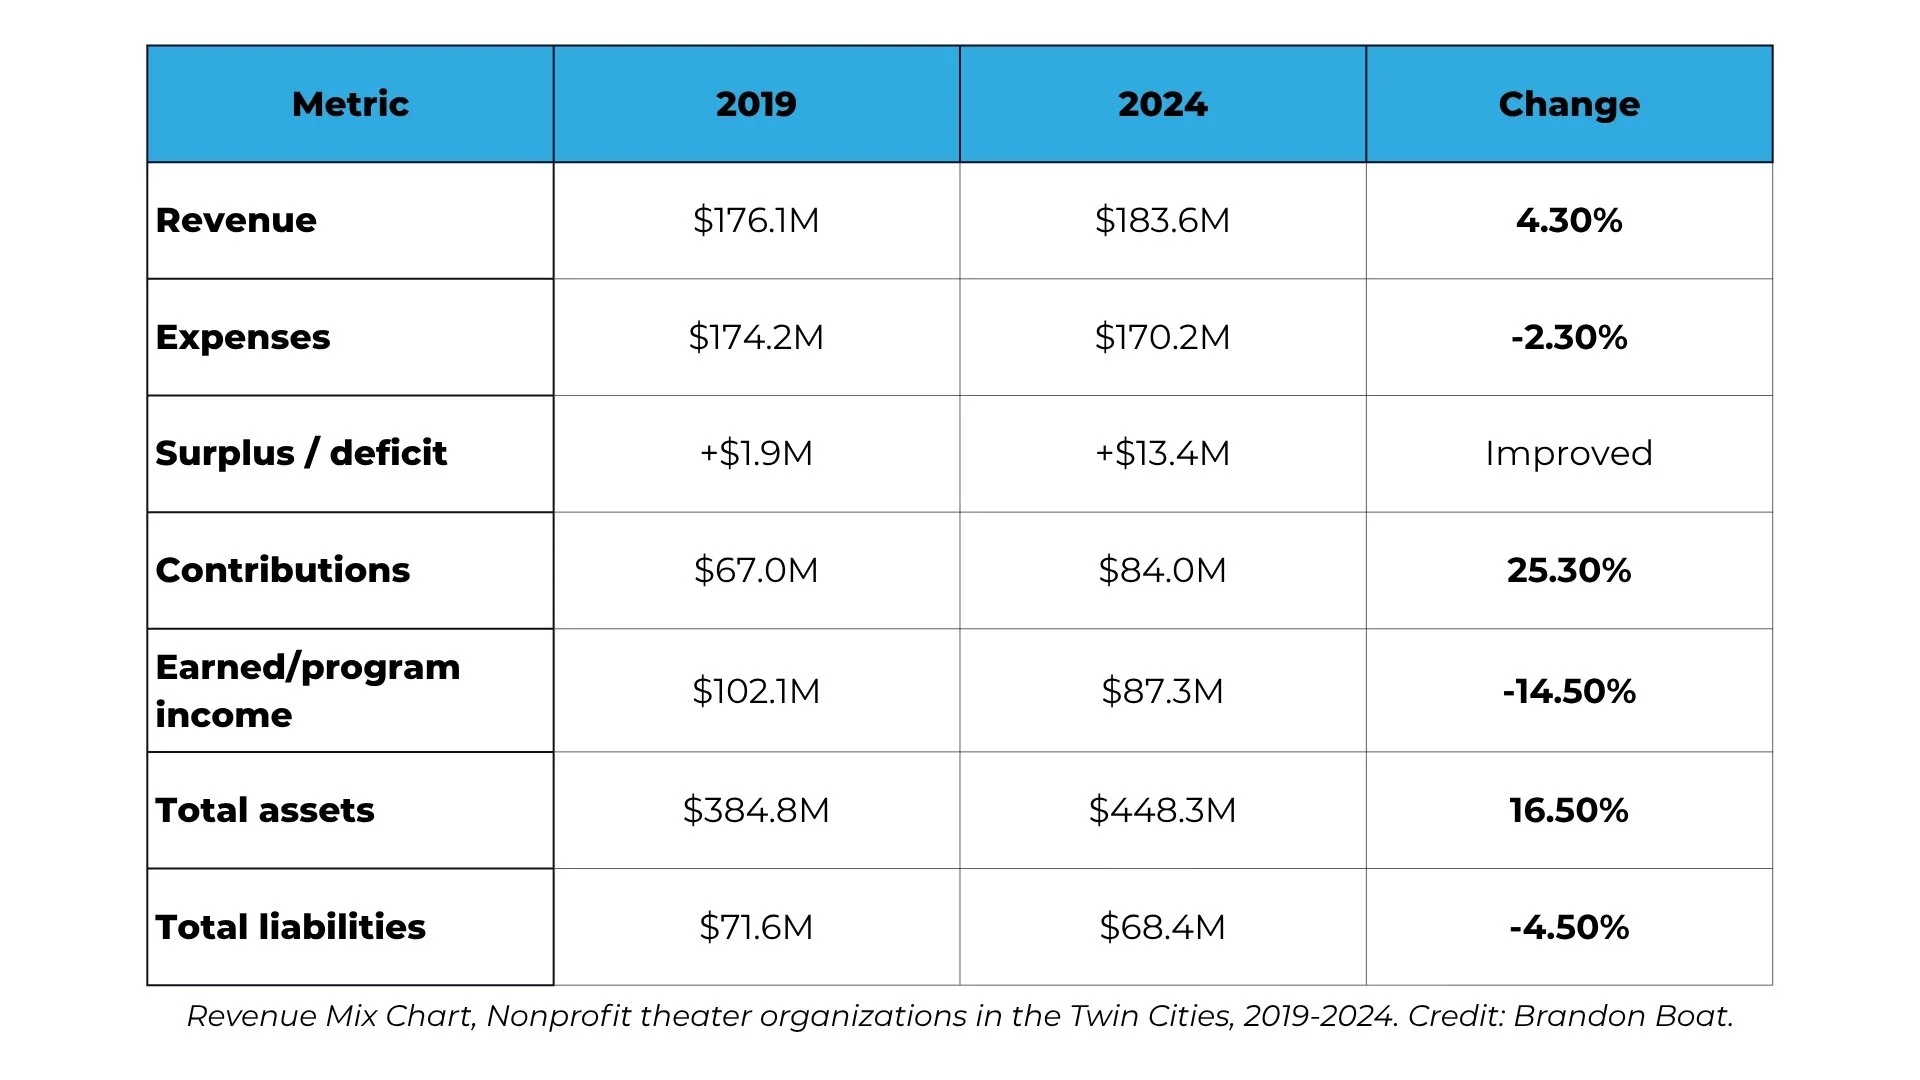
The Twin Cities theater scene appears to have recovered in aggregate revenue, with total revenue reaching $183.6M in 2024, surpassing the pre-covid peak of $176M, a new record. But at a close glance, you’ll notice the sector ran deficits in 4 of the 14 years tracked (2012, 2013, 2017, 2020), and the aggregate surplus in good years is being carried almost entirely by large institutions.
Strip out the Guthrie, Hennepin Theater Trust, and Children's Theater Company, and the picture changes dramatically.
Deficits
The health of mid-sized and smaller theaters may be weaker than the aggregate numbers suggest. Chronic deficit spending was a pre-existing condition before COVID hit. Across the field, a $13.1M surplus in 2024 hides the fact that 38 of 76 organizations (HALF of all theaters studied) were in deficit.
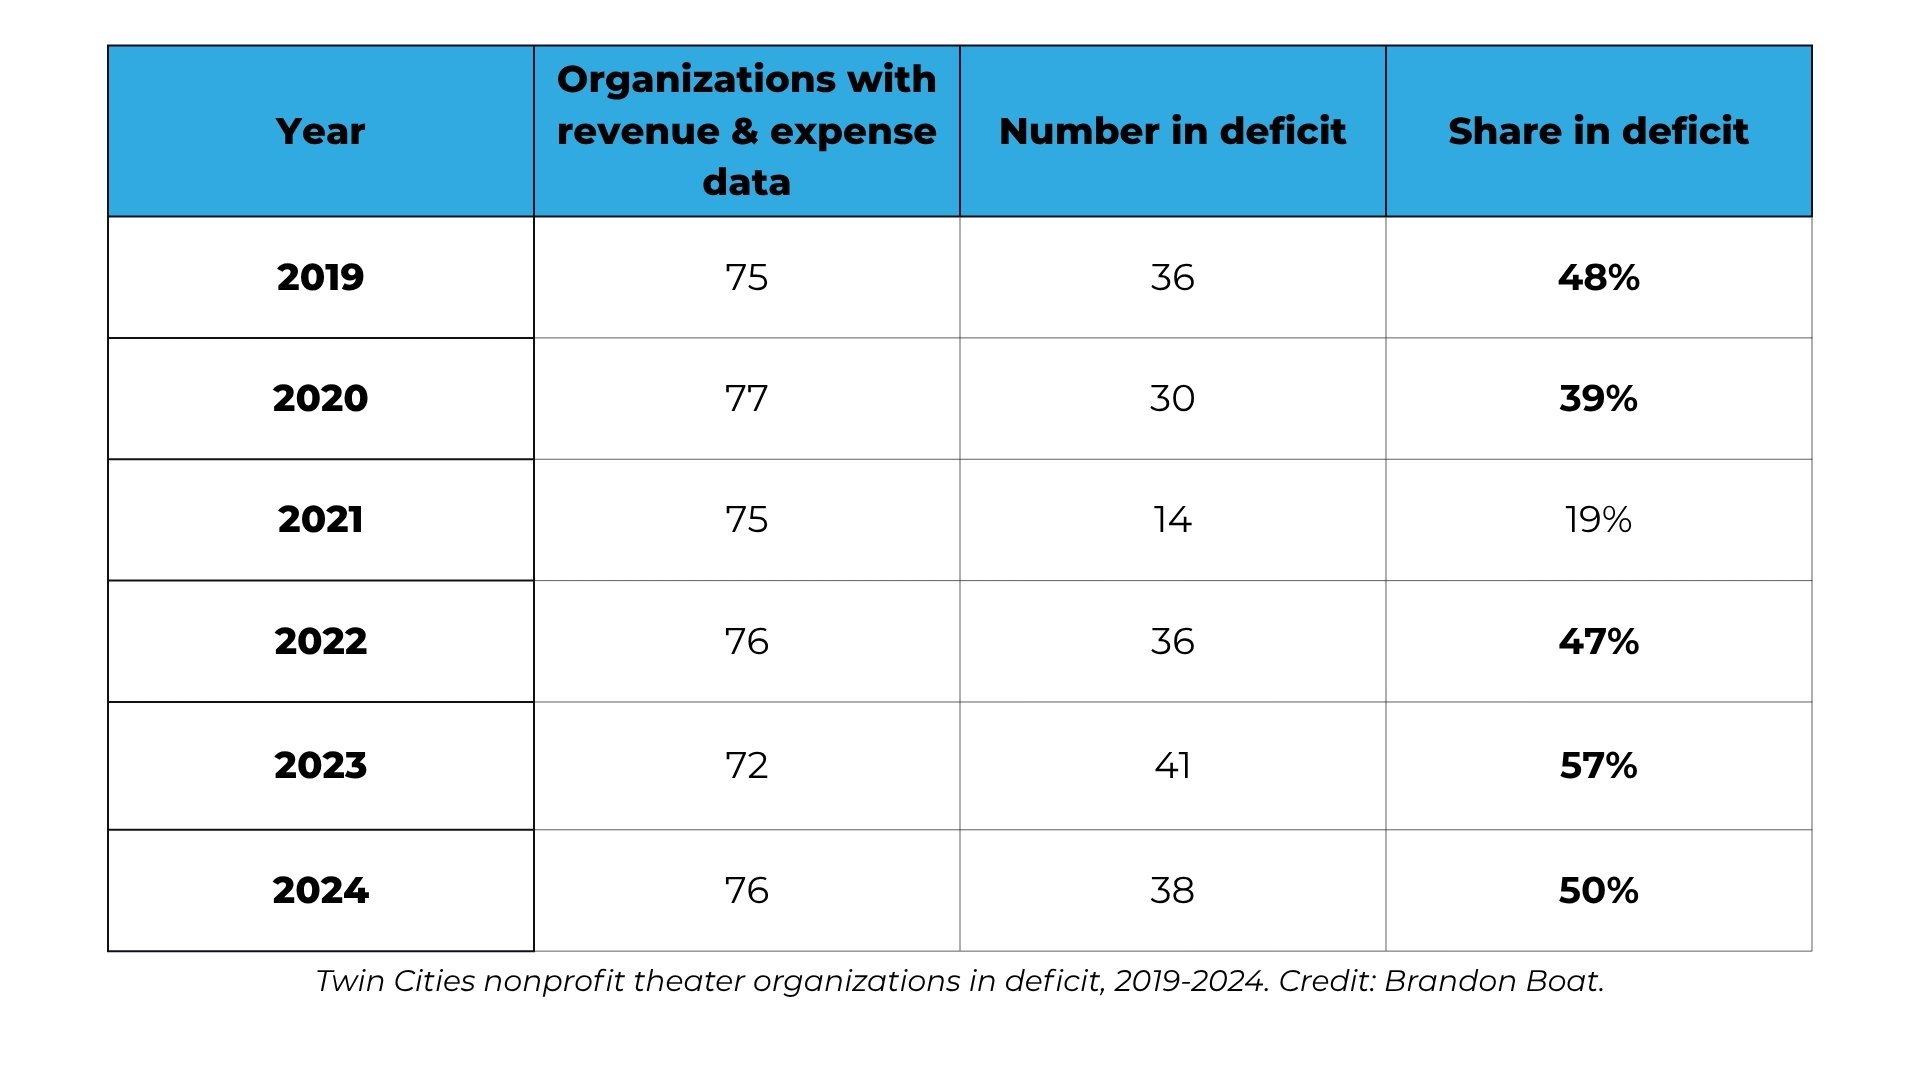
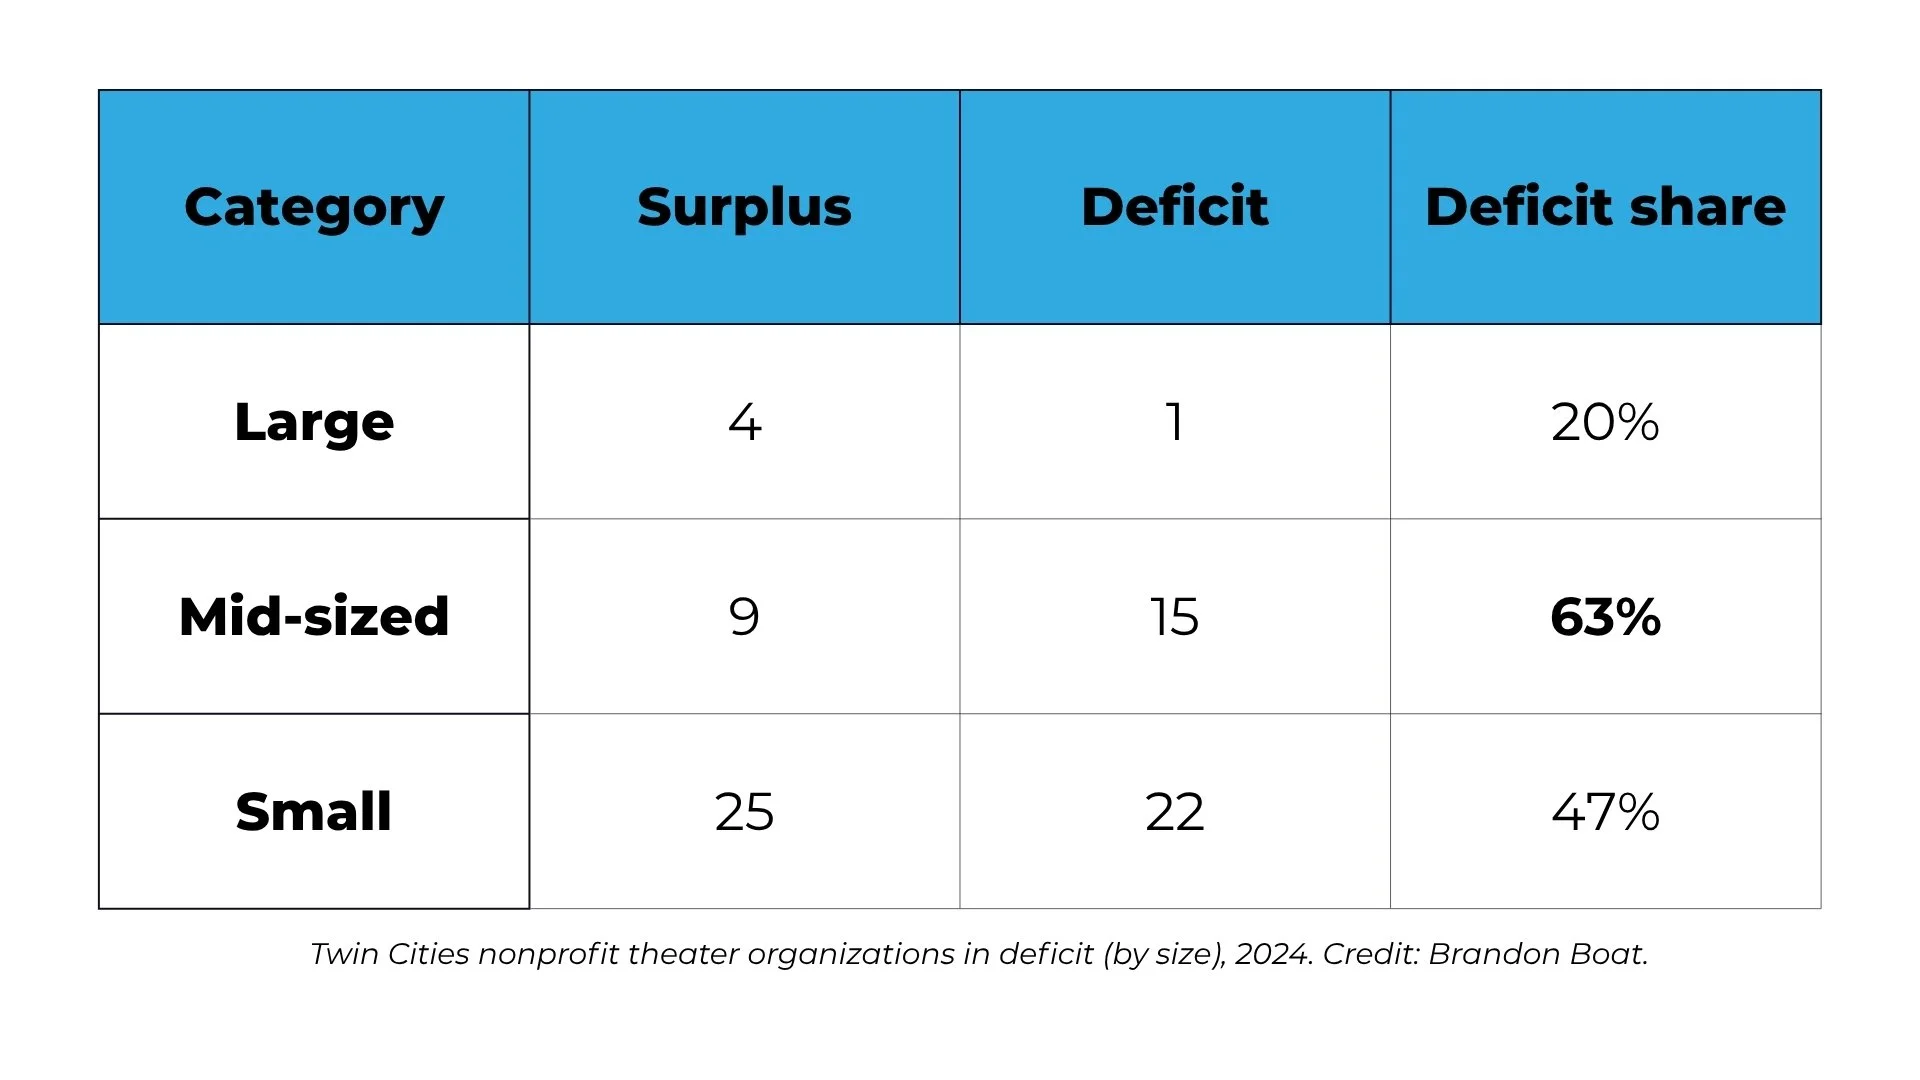
From 2019–2024, 18 organizations had deficits in at least 4 of 6 years where data was available. The deepest stress in theater is not concentrated amongst the largest institutions, but lives in the middle of the ecosystem. In 2024, the field is split in half with 38 surplus, 38 deficits. Mid-sized theaters had the highest deficit rate in 2024, even though the mid-sized category overall showed a positive aggregate surplus.
Program Services Crisis is Central Story
In 2021, program services (ticket sales, programs, etc.) collapsed to just 6.7% of total sector revenue—essentially nothing. The sector survived on contributed revenue (donations and grants), which ballooned to 89% of revenue that year. There were also one-off giving initiatives such as the Regional Cultural Treasures Grant.
Program Services have not fully recovered to 2019 levels for much of the middle of the sector. The theaters that are doing well are those that either (a) found alternative earned revenue streams, or (b) had strong development capacity to grow contributed income. (Further investigation could be done into organizations’ fundraising expenditures and who is getting the best return.)
In 2019, program services represented about 58% of total revenue across the dataset. By 2024, it had fallen to about 47.6%. Contributions rose from about 38.1% of revenue in 2019 to about 45.8% in 2024. This suggests the Twin Cities theater ecosystem may be less box-office/program -service driven than it was pre-pandemic, and more dependent on fundraising, grants, and contributed support.
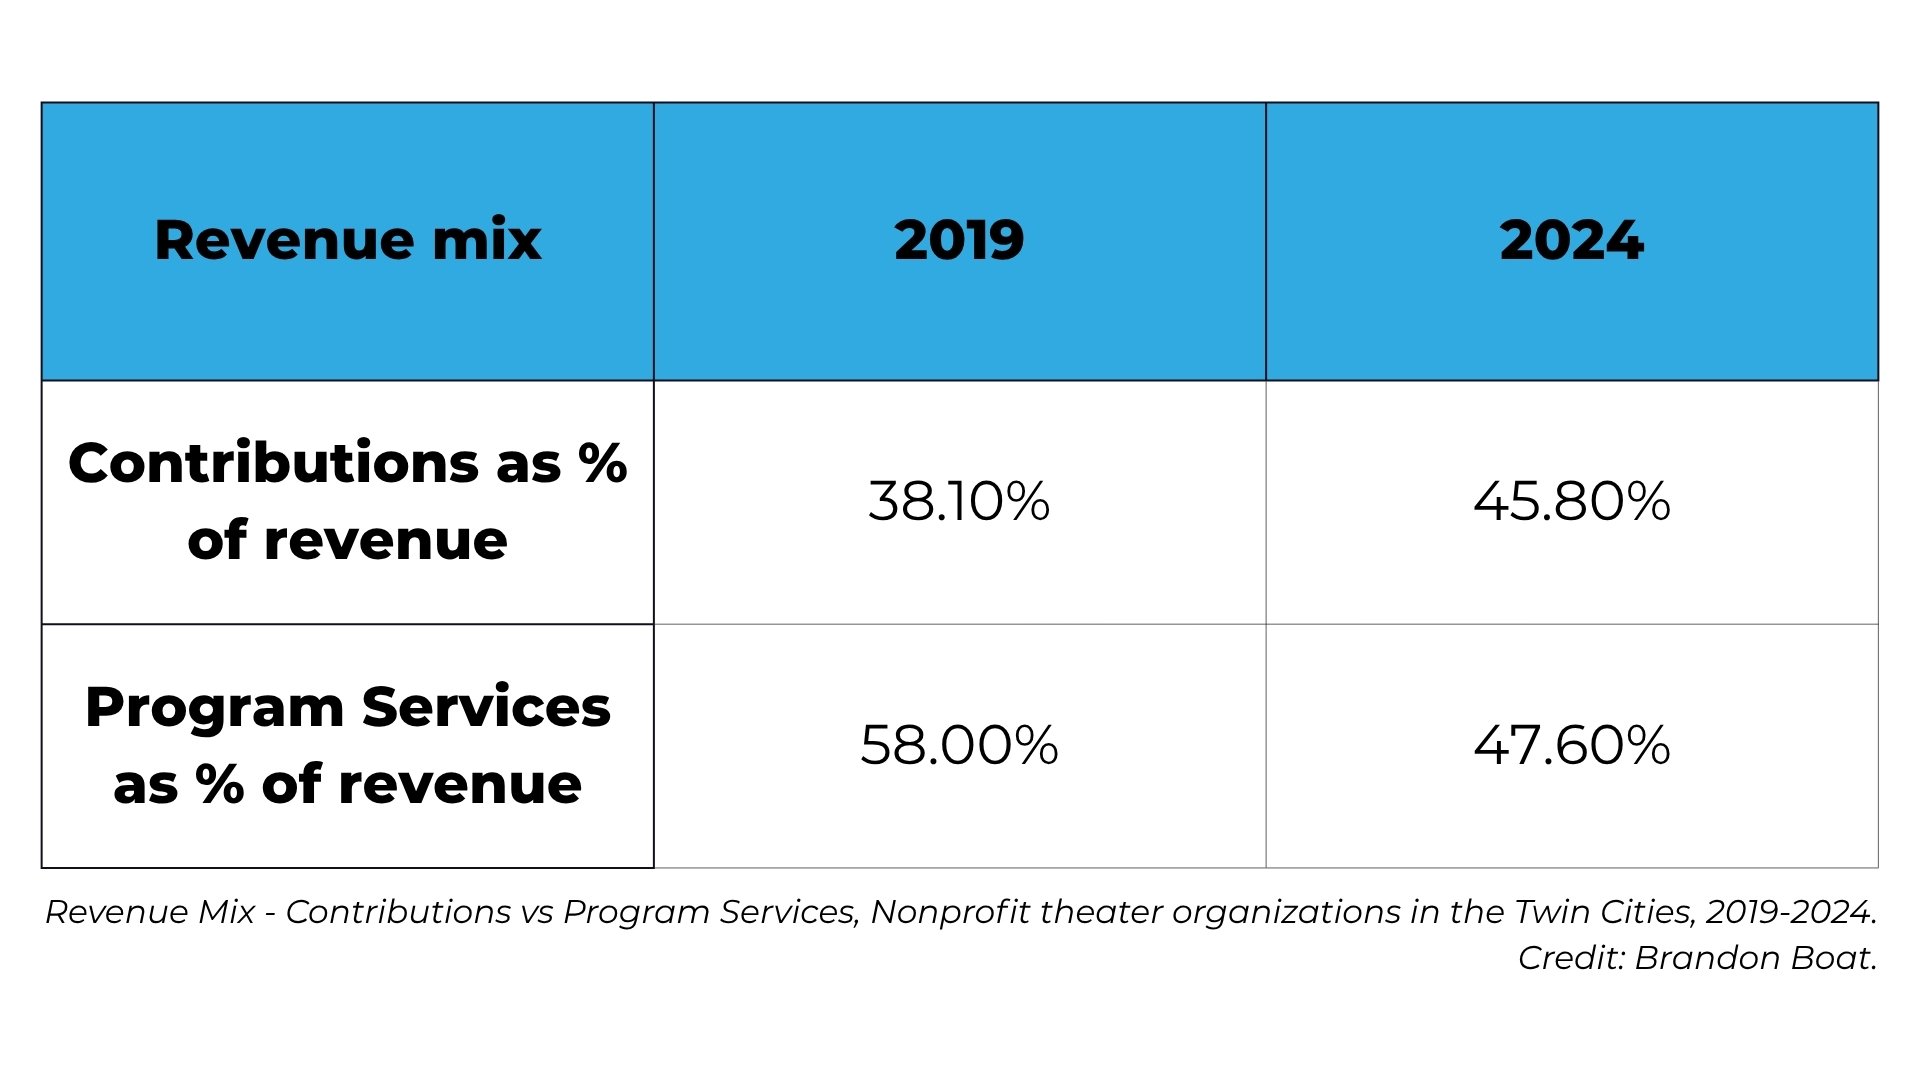
The important question is whether 2023–2024 represents a stable new normal, or whether this period is at the tail end of the sector’s increased reliance on emergency support, recovery grants, one-time gifts, or temporary balance-sheet cushioning.
2. Large Theaters (5 Orgs - $10+ million)
The five largest theaters accounted for roughly 69% of total sector revenue. That means the aggregate health of the “scene” is heavily shaped by a few major institutions.
Their story is one of resilience rooted in asset wealth. Total assets stand at $363M in 2024, up from $318M in 2019, and program services have largely recovered (85% of 2019 levels). The one notable concern: they ran deficits in 6 of the 14 years, including four consecutive years from 2015-2017. These are large organizations with high fixed costs, and they don't run surpluses easily even in good years.
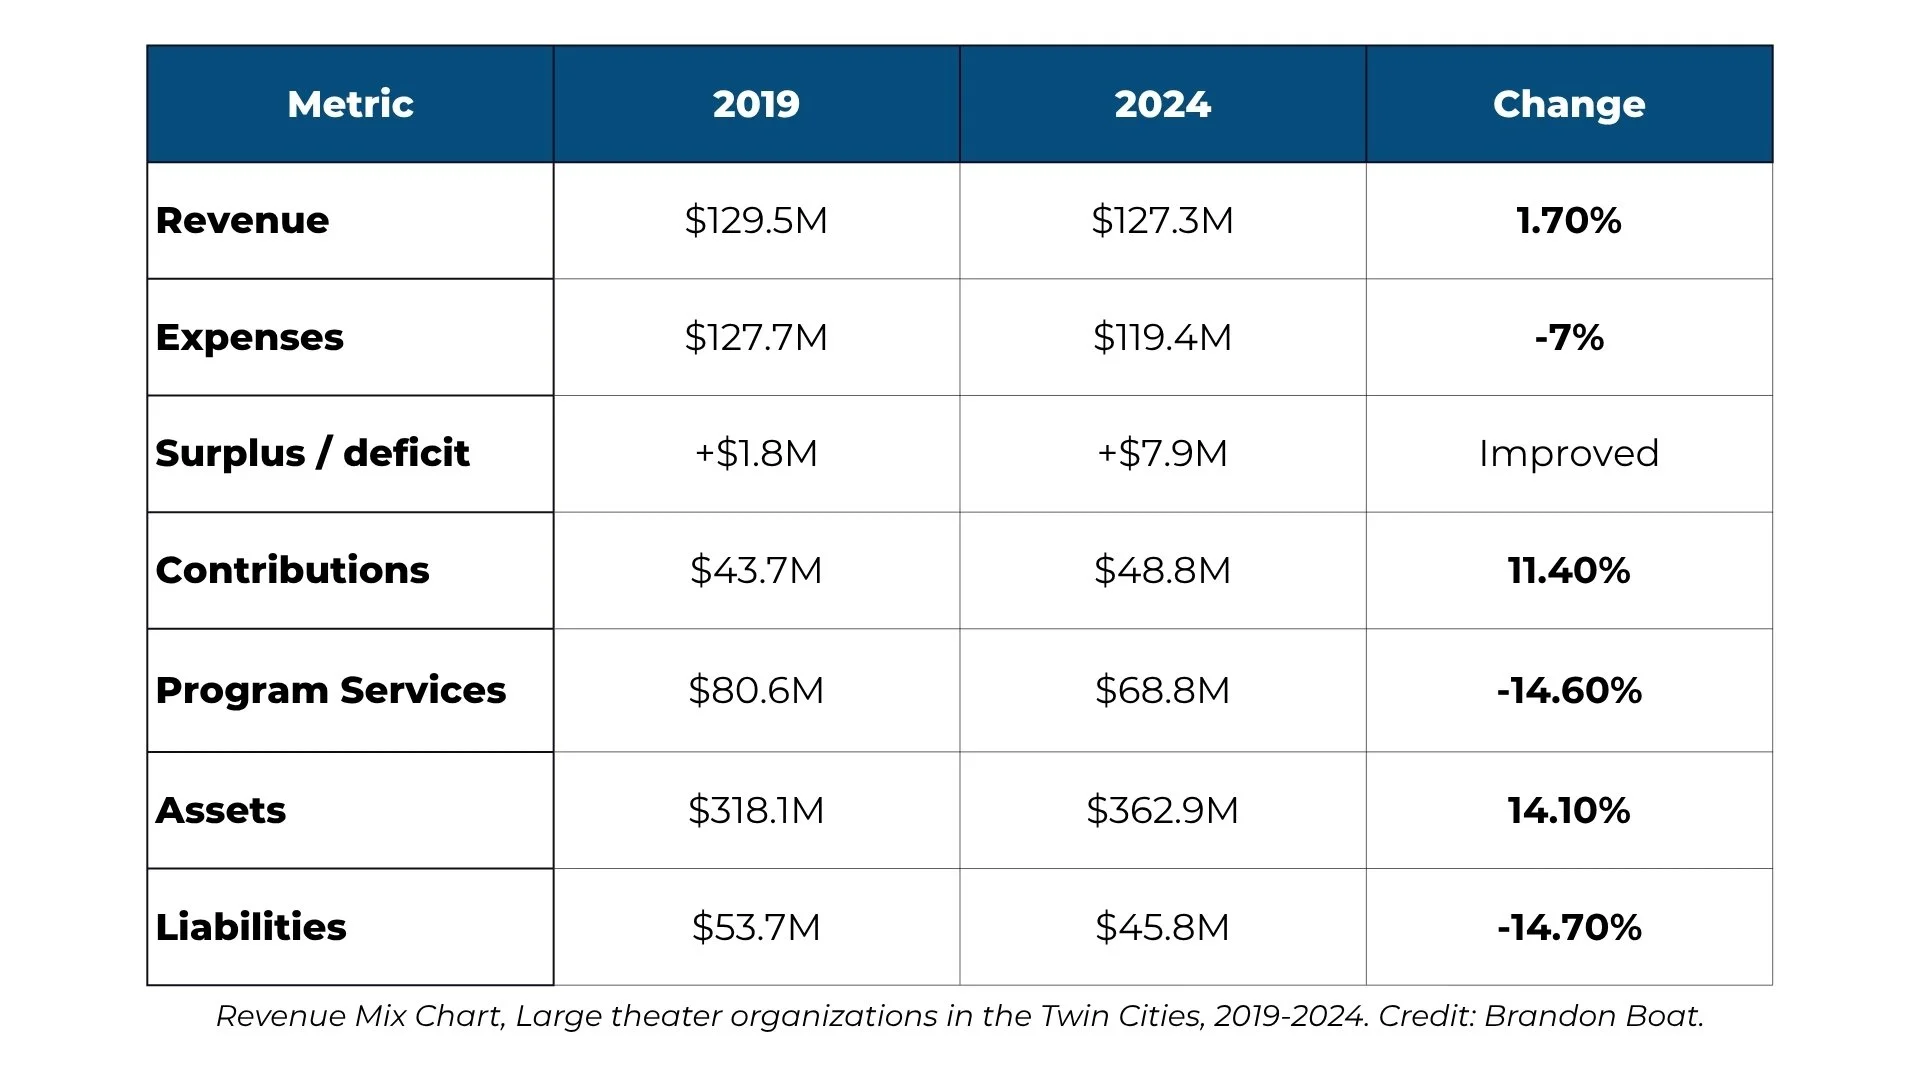
The Revenue Mix chart shows that there was a modest shift in the percentage of the revenue share coming from contributions and earned income.
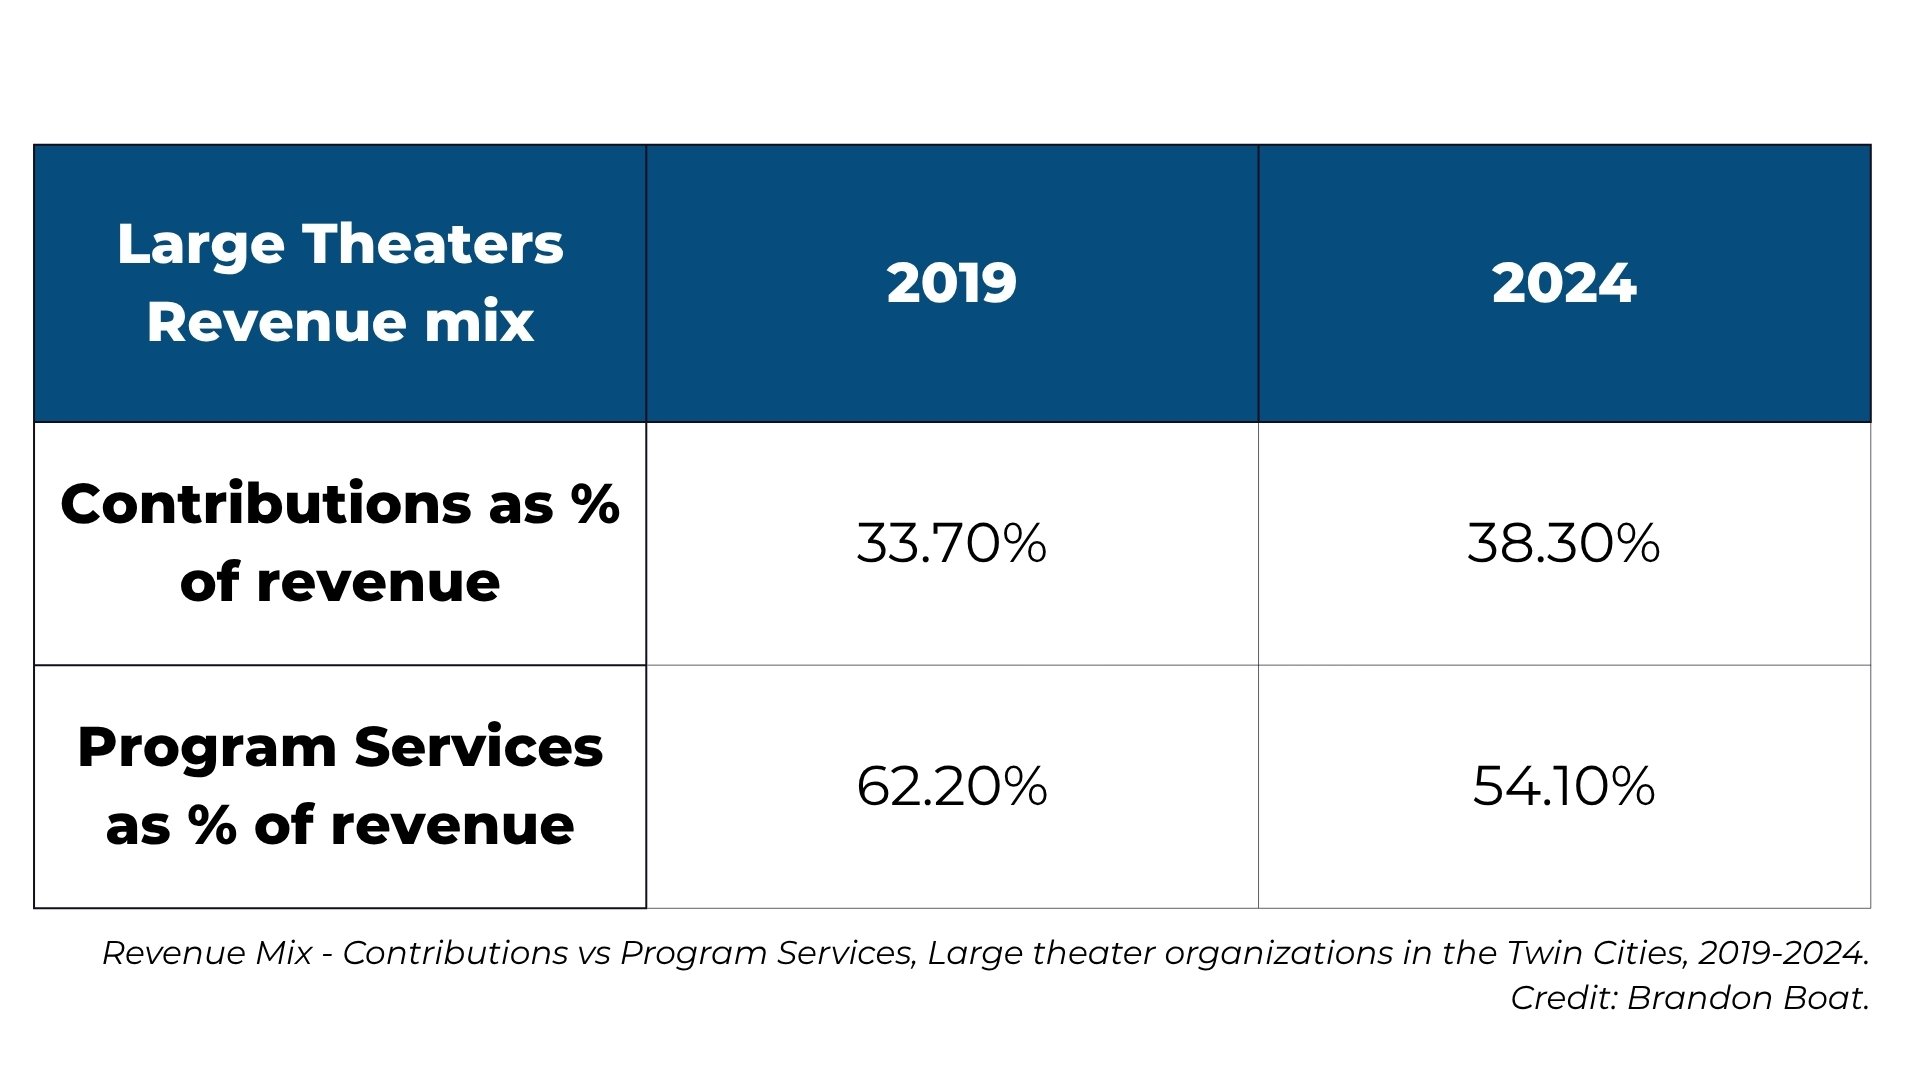
Fundraising Pays
Fundraising infrastructure that was developed to replace lost earned income in 2020 and 2021 is paying off considerably. The large institutions have recovered, but not by returning to the old earned-income structure. Contributions are playing a much bigger role.
That matters because while large theaters are able to raise major gifts, foundation support, and government support for their programs, mid-sized or small theaters may not have the same options for recovery.
3. Mid-Sized Theaters (27 Orgs - $500k to $5M)
The revenue mix for mid-sized theaters has fundamentally shifted since 2019.
Pre-COVID, mid-tier theaters ran roughly 41% program services. By 2024, they've settled into 23% for program services — a structural downshift of 18 percentage points. They are now more contribution-dependent than at any point in the dataset, and contributions are volatile. The 2021 surge (90% contribution year) was extraordinary and won't repeat.
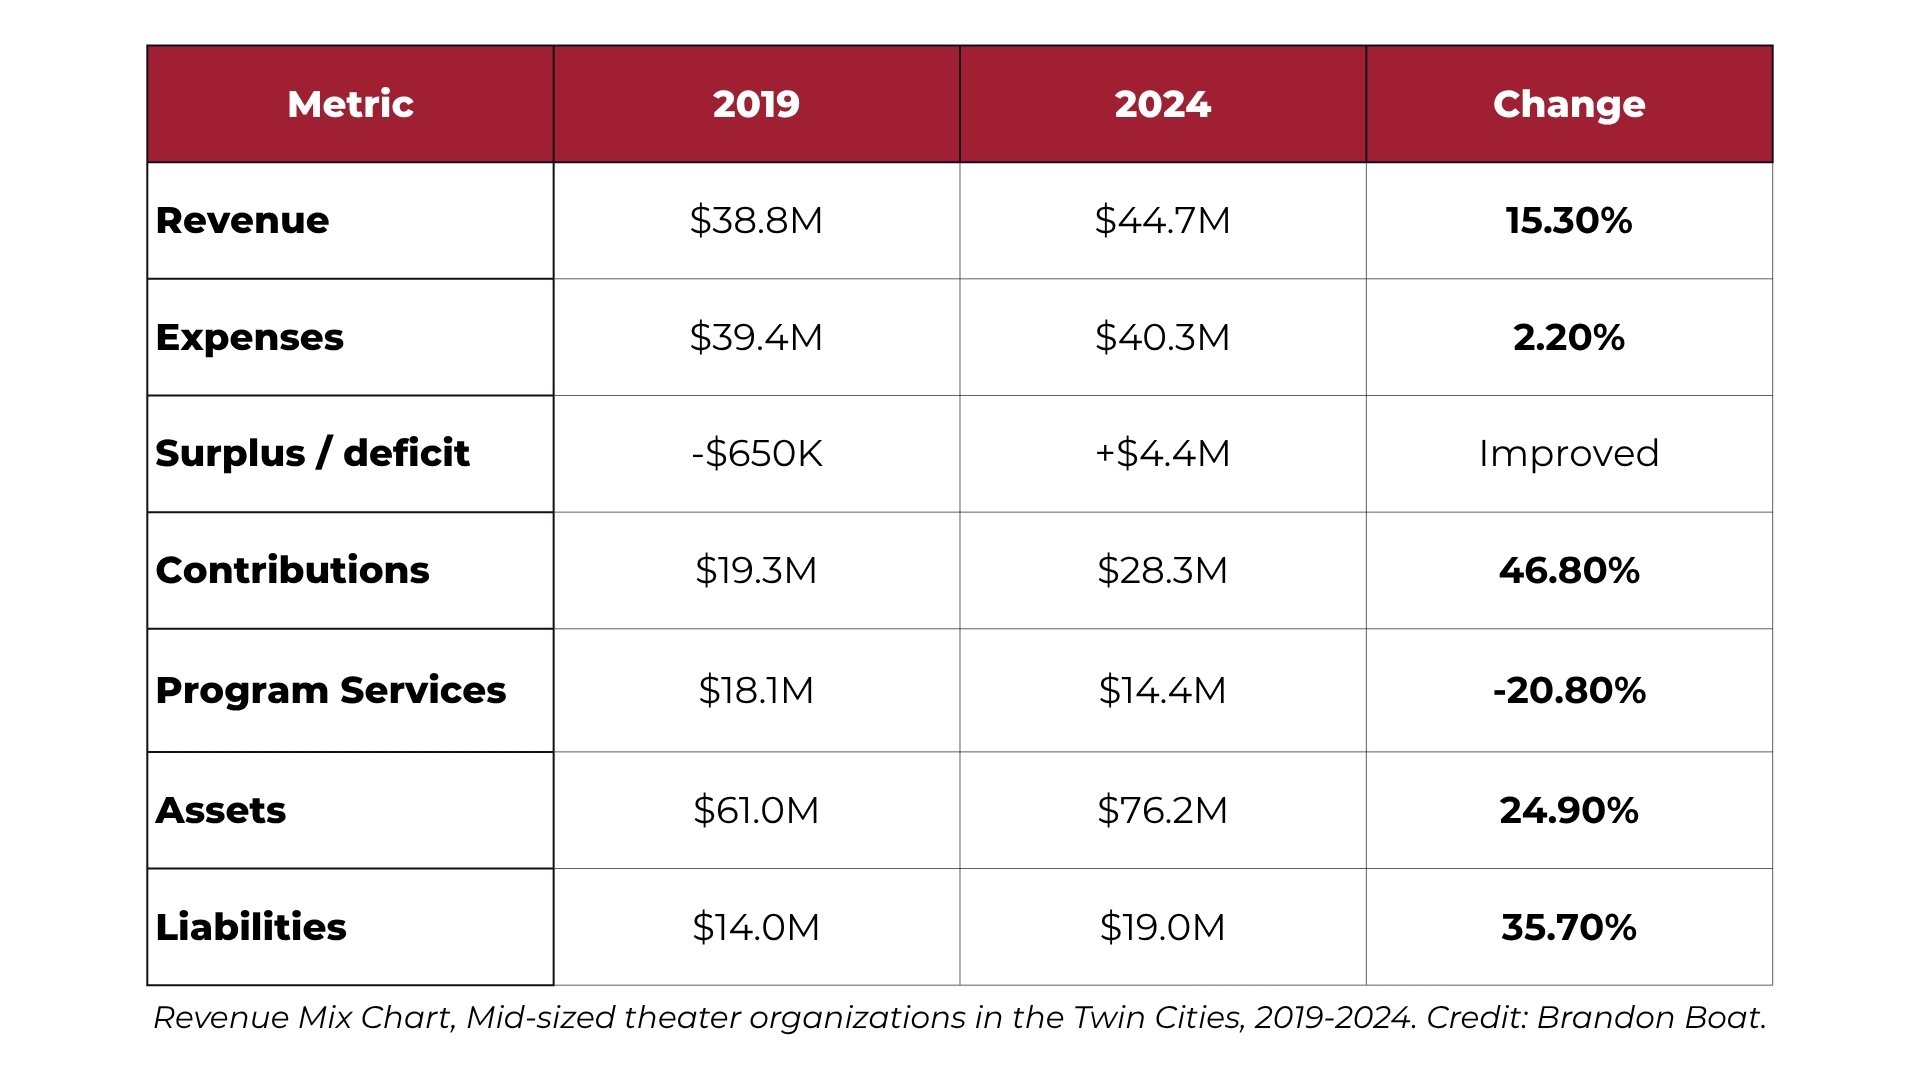
Net assets for the mid-tier are growing, but unevenly. Sector net assets for mid-sized theaters have risen from $19M in 2011 to $58.8M in 2024. That sounds extraordinary, but it's driven by a small number of organizations that built reserves during the 2021–2022 surplus years. Many others are quietly declining.
Of the 24 mid-size theaters with data in both 2019 and 2024, roughly half are running worse deficits in 2024 than they were pre-COVID. These are not recovering — they are slowly bleeding.
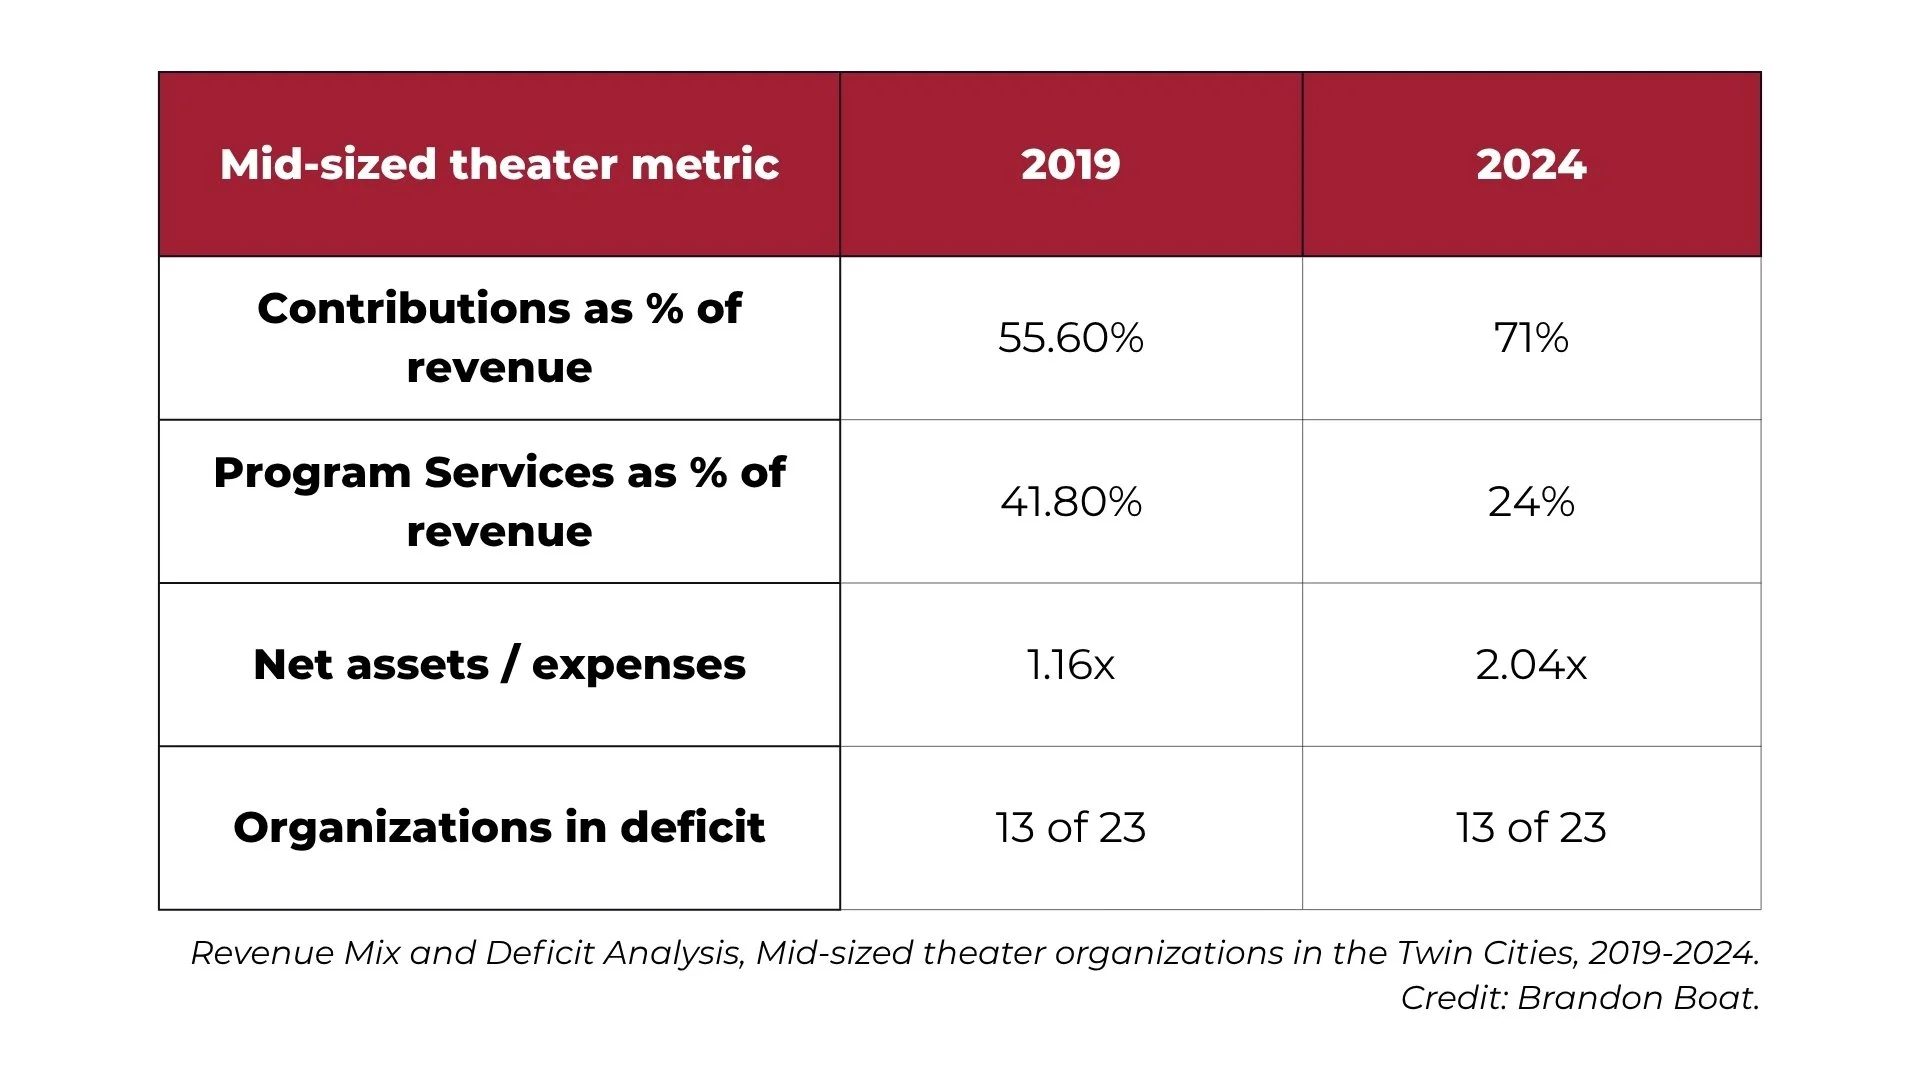
Mid-sized theaters are now, in aggregate, more contribution-driven than earned-income-driven.
That may be sustainable for some, especially those with strong development capacity. But it creates risk for organizations that do not have the fundraising infrastructure of the large institutions. Theaters that are thriving have strong mission-aligned contributed income that didn’t depend solely on box office recovery.
4. Small-Sized Theaters (60 Organizations - Under $500k)
Small theaters are numerous, but not financially significant. They represent 65% of the organizations, but only 2.5% of 2024 revenue. They may not drive the sector's financial totals, but they matter enormously to the ecosystem’s diversity, experimentation, access and artist pipeline.
The small theater picture is surprisingly resilient in aggregate, and quite different in character. Their revenue mix has always leaned more towards contributions (55% in 2019), so the post-COVID shift to grant and funder dependency (57% in 2024) was less disruptive because it was already their baseline.
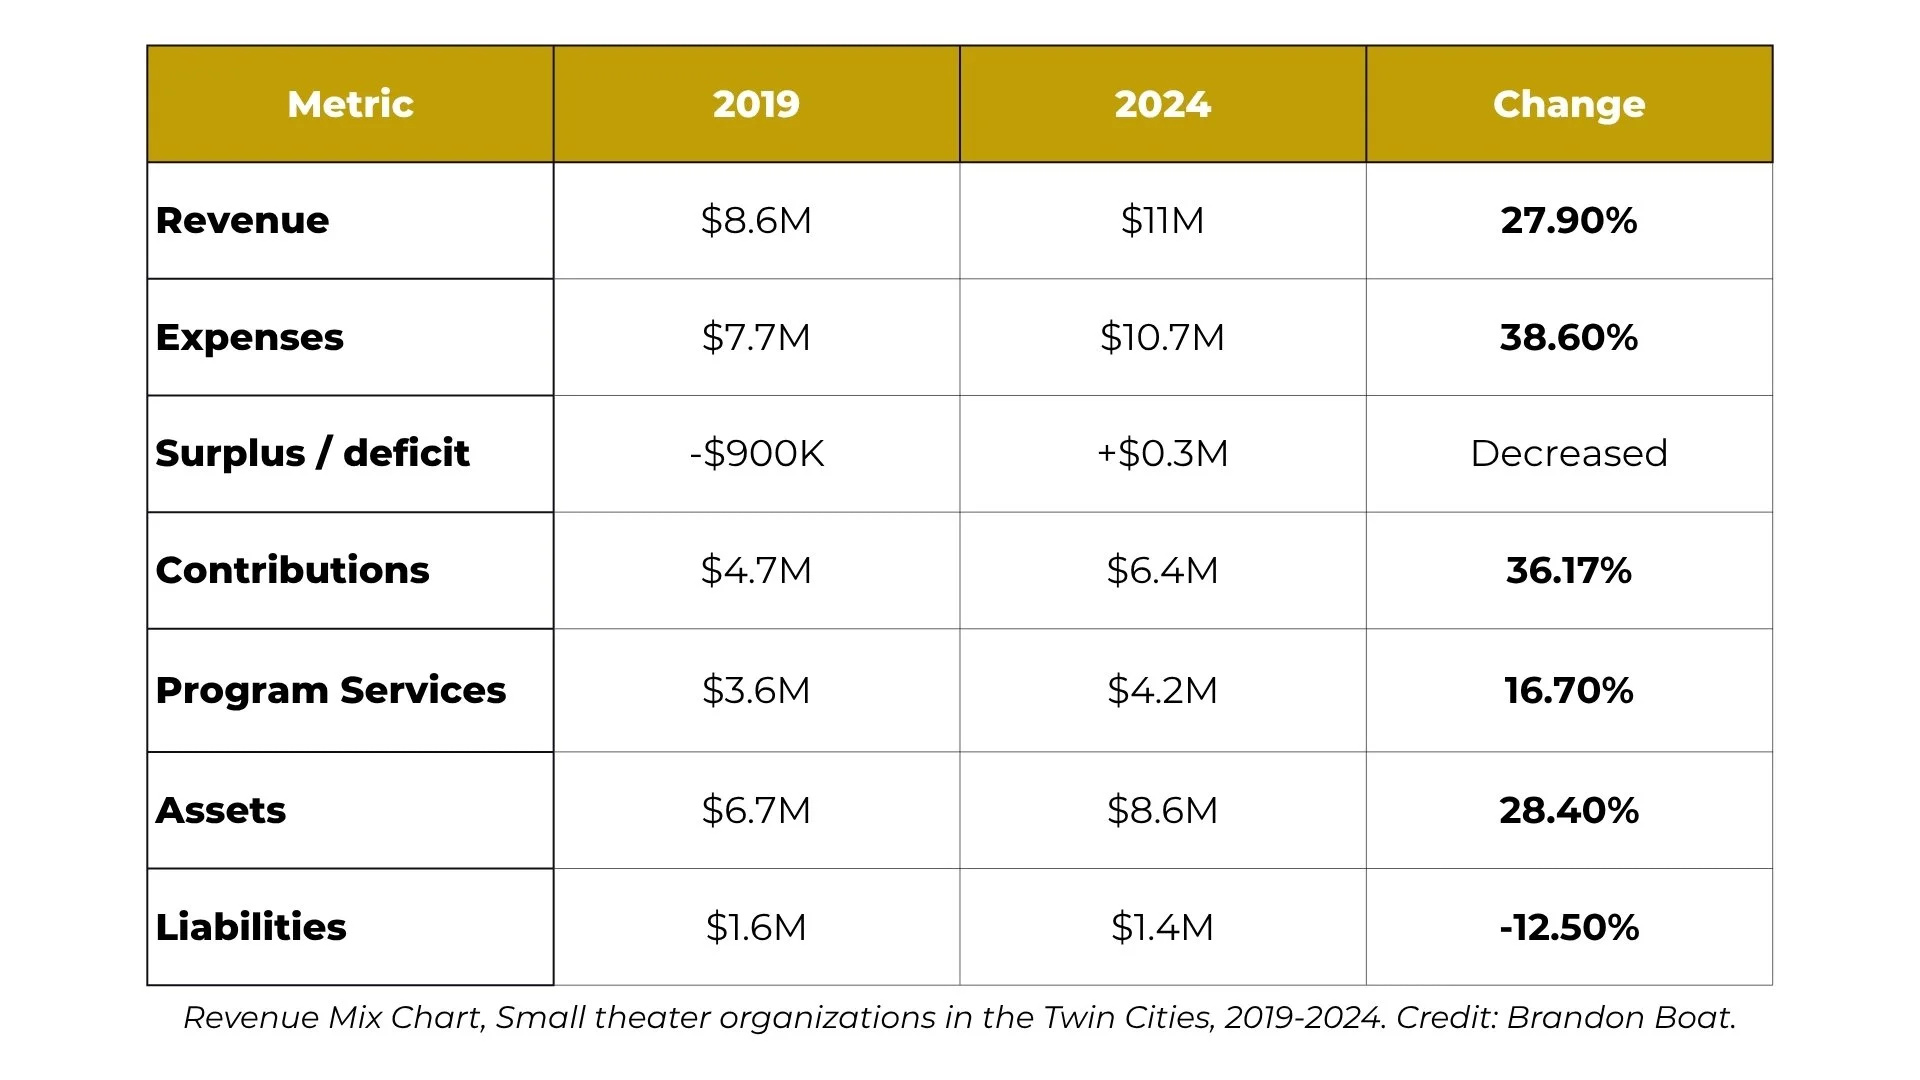
Small theaters as a group ran surpluses in 9 of 14 years, including every year from 2015–2021. They're lean by necessity.
At this scale, the math is simpler: low fixed costs mean a small grant or individual donor can swing an org from deficit to surplus. The aggregate net assets for the small tier have grown from $4.6M in 2011 to $8.6M in 2024—not large in absolute terms, but steady.
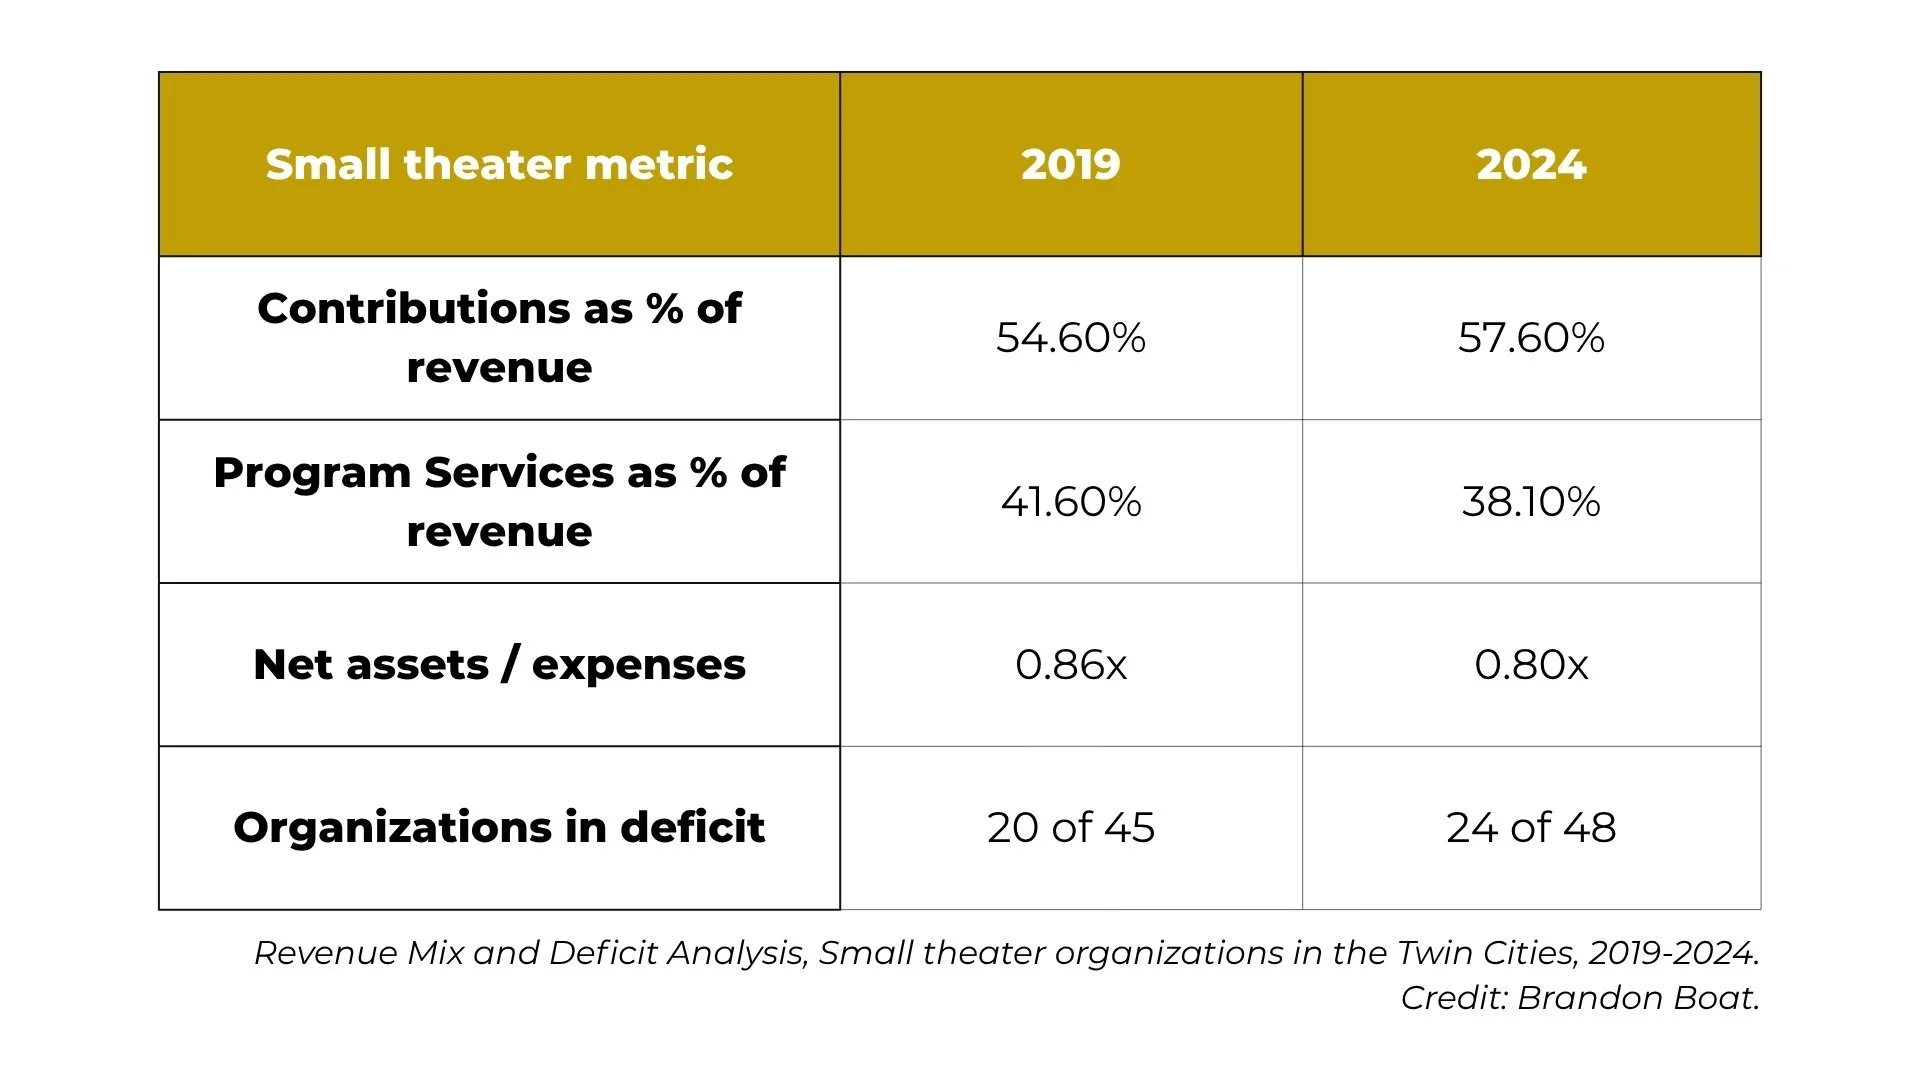
Small theaters have a much thinner cushion than large or mid-sized organizations. Their aggregate net assets equal about 0.86 years of expenses, compared with 3.04x for large theaters and 2.04x for mid-sized theaters. So even when small theaters look better in aggregate, they remain financially exposed. One weak season, lost grant, HVAC replacement, or leadership transition can matter a lot.
5. 2025 Trends
We’re still early for 2025 data as only 50 theaters have available data, compared with 76 in 2024. but the initial picture is that we’re in a much weaker position.
Earned income is still not fully back to pre-pandemic strength and appears mostly stable (Outliers being an $11M drop by Hennepin Theater Trust as well as a $3M building sale by HUGE Theater). But the bigger immediate problem may be that contributed income fell from 59M to 44.1M - a 26% single year drop.
If contributed support is now normalizing downward, theaters may be exposed again. It’s possible that the drops are concentrated around grant cycles rather than a donor retreat, but a simultaneous pattern is worth watching out for.
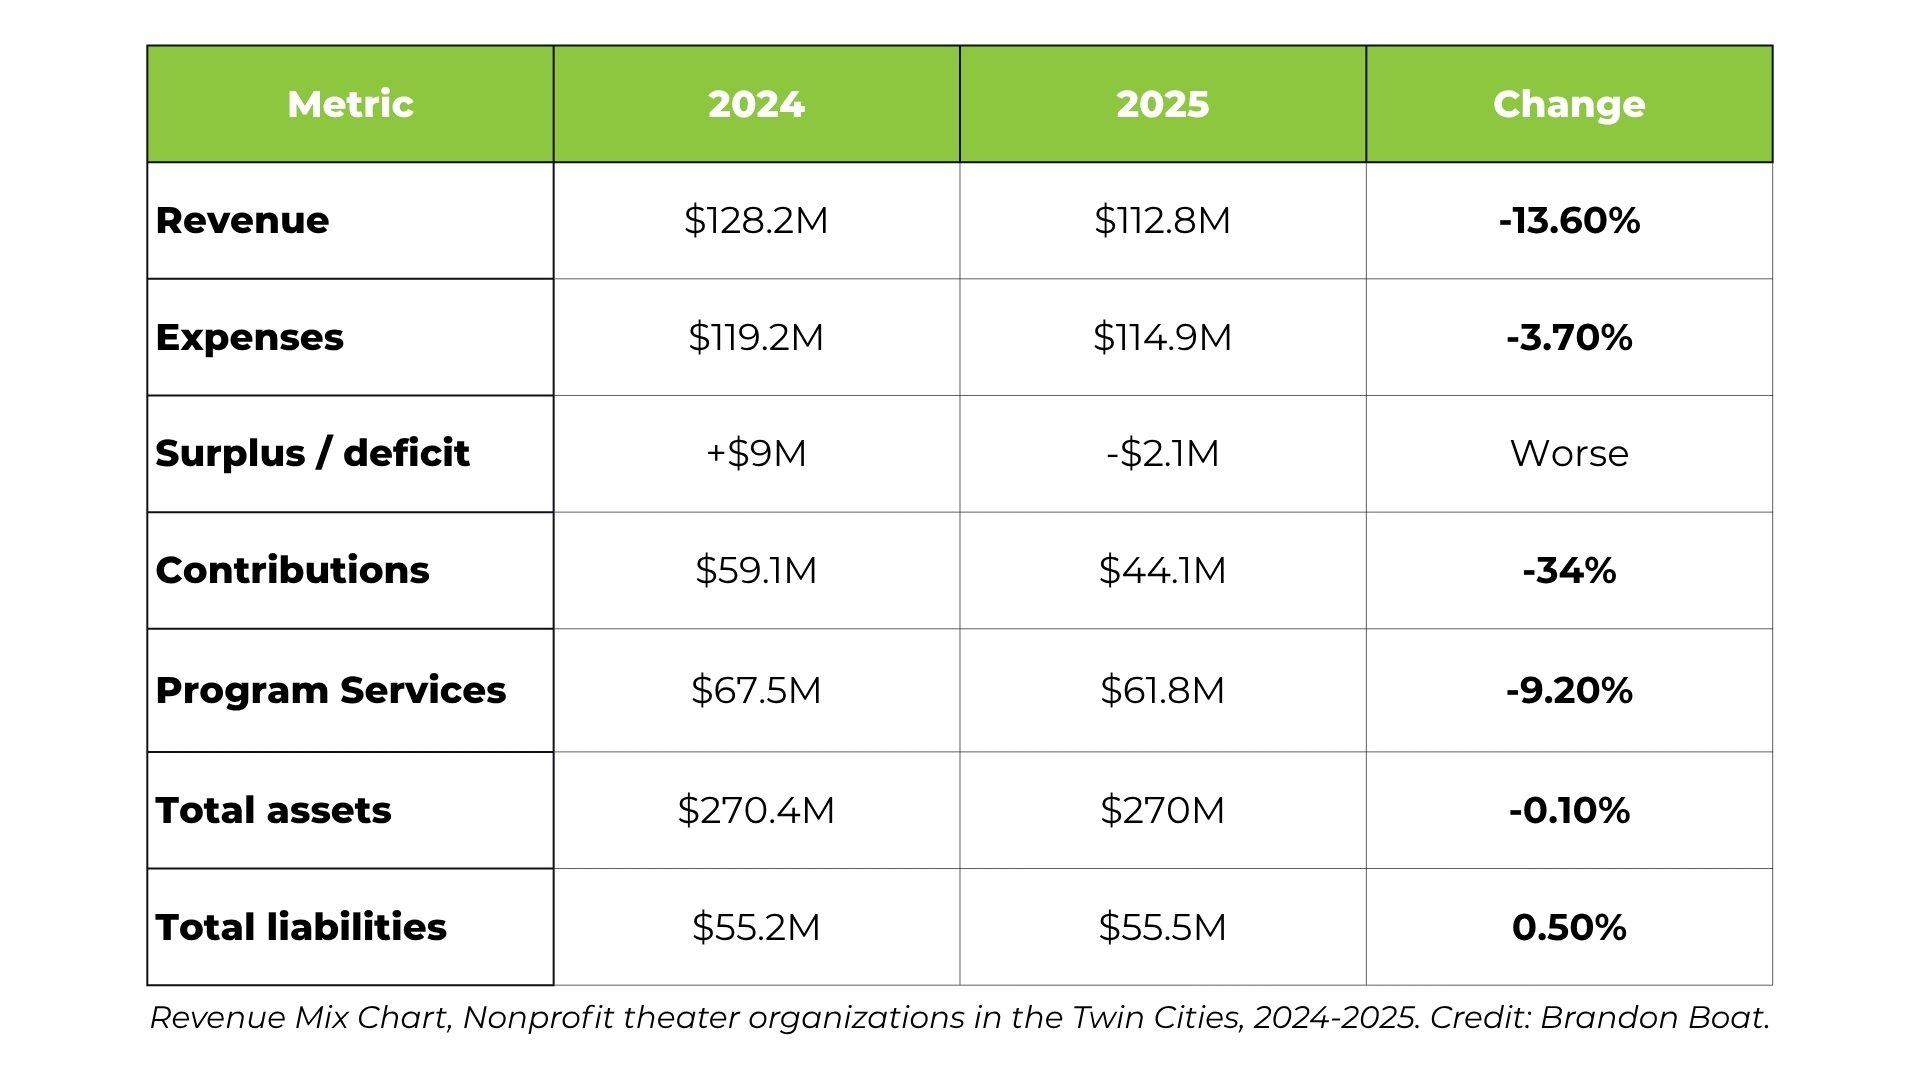
Among theaters that have reported 2025 data, deficits are more common and contributions appear lower as a share of revenue.
The 2024 full-scene picture looked like “nominal recovery, but with a changed revenue model.”
This 2025 subset looks more like “not yet recovered, and possibly weakening again.” 68% of theaters in the collection are in a deficit, and there is a $15.4M difference between 2024-2025 Revenue.
The early 2025 data suggests the Twin Cities theater recovery may be softening. For the theaters that have reported 2025 data, aggregate revenue is down sharply from 2024, contributions have fallen faster than earned income, and the share of organizations running deficits has increased. The decline is heavily concentrated among the large theaters included in this file, while mid-sized theaters show a quieter but concerning pattern: contribution declines, thinner margins, and more organizations in deficit. Small theaters remain financially fragile, though they improved slightly in this limited cohort.
The 2025 data is partial and will look different once all 990s are filed. But the direction it's pointing — declining contributions, flat-to-declining net assets, sector-wide deficit — suggests 2025–2026 will be a genuine stress test for any organization that didn't use the 2021–2022 surplus years to build reserves.
Conclusions
The Twin Cities nonprofit theater sector is not uniformly declining, but it is structurally changing. By 2024, the field looks stronger in aggregate than it did in 2019, largely because expenses were controlled and contributions increased. However, earned/program income remains below 2019 levels, revenue is highly concentrated among five large institutions, and mid-sized theaters show the most concerning pattern: high contribution dependence, weaker earned income, and the highest rate of deficits in 2024. Small theaters are growing in aggregate but remain thinly capitalized and volatile.
Larger institutions have balance sheet assets and fundraising infrastructure that insulated them; smaller theaters with lower overhead adapted more easily; the middle had neither advantage.
The contribution boom of 2021–2022 papered over the earned income deficit for everyone. Now that contributions have receded toward pre-COVID levels, the mid-tier theaters that didn't rebuild their box office, or whose model depended on programming that hasn't returned, are the most exposed. That is likely the core explanation for why several mid-sized theaters have closed or are struggling: they became structurally dependent on a level of philanthropic support that was never going to be permanent and audiences have not returned to previous levels.
The consistent deficit spending in the sector highlights the importance of maintaining operating reserves, which is easier said than done when margins are so low.
***
Thank you to Leah Cooper of Wonderlust Productions and Carl Swanson of Cast Consulting for reading and providing feedback prior to publishing.

Author: Brandon Boat (he/him)
As co-founder of Danger Boat Productions, Brandon has produced and/or performed in more than 1000 shows that have delighted and surprised audiences throughout the US. In addition to performing, Brandon oversees the logistics of all Danger Boat’s productions and the company’s daily operations and finances as well as cast coordination, client collaboration and so much more.
